443-287-4832

Menu
Multiplex Data Analysis

Data from a multiplex output can be used as the quantitative mean fluorescence intensity (MFI) value or as a binary seropositive or seronegative value. A seropositive result can be interpreted as positive for exposure to or infection with a pathogen, or a certain level of seroprotection generated by vaccination depending on the antigen.

Multiplexed serosurveillance assays can efficiently provide information about serological responses to multiple antigens, but these assays also have their challenges for data analysis.

Positive and negative controls must be identified for each antigen (and those controls must be comparable to the study population), and study plates must include controls for all antigens to determine whether interplate variability could affect study results.


Results for each antigen must be considered individually, and analyses can account for antigen kinetics and whether seropositivity could be affected by vaccination or cross-reactive responses.


More complex analyses can also take advantage of results from multiple antigens together, either from the same or different pathogens, to build a more complete antigenic profile of subjects and of the study area.


Analyses can also incorporate other variables, such as age, to generate seroprevalence curves by age.

Defining Cutoffs for Seropositivity

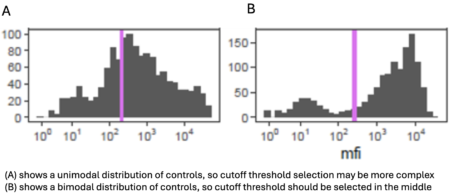
There are several methods for determining the MFI cutoff value for seropositivity for each antigen. The method selected often depends on: 

  • the availability of controls,  
  • the scientific question of interest, and  
  • how the results will be used. 

For example, if the results are being used to verify elimination of a pathogen, sensitivity may be prioritized over specificity. 

Figure 1. Example distributions of controls and how to define seropositivity cutoffs 


Many serosurveys calculate rates of seroprevalence, a measure of the proportion of people with positive antibody titers to a particular antigen. To calculate seroprevalence, researchers must establish cutoffs for each antigen to determine whether each sample in the study is seropositive or seronegative. Some common methods of establishing cutoffs for positivity include: 

  • using established thresholds (i.e., international standards) 
  • using negative controls from unexposed or pre-exposed cohorts,  
  • using positive and negative controls in a receiver operating characteristic (ROC) curve analysis, and  
  • using a finite mixture model (FMM). 
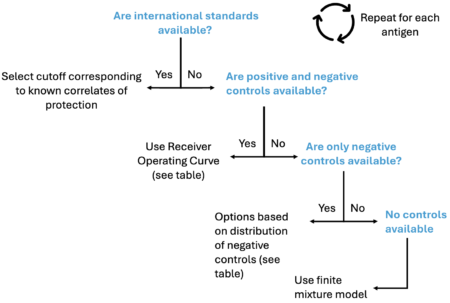
Figure 2. Availability of controls to establish cutoffs


More information about these methods are shown in the table below. The table shows an example of how cutoffs can be determined, in the order that cutoff methods could be considered to define cutoffs for each antigen based on type of controls available (flowchart). Although different methods can have different strengths and limitations, there isn’t always a single clear answer for determining methods of cutoffs or analysis. 

Type of controls available Methodology Pick cutoff that
Availability of international standards Translation of values to international units Corresponds to known correlates of protection
Availability of both positive and negative controls Receiver Operating Curve Maximize Youden’s J
If sensitivity is lower than desired Receiver Operating Curve with floor value for sensitivity Maximum specificity possible with sensitivity of at least 75%
If sensitivity, specificity, or seroprevalence do not seem reasonable given local context  Receiver Operating Curve Select cutoff to match estimates in line with local context or prior studies 
Availability of only negative controls Sample mean plus 3 standard deviations Sample mean plus 3 standard deviations on the natural scale
If controls are not normally distributed or have small number of controls  Highest negative control Highest negative control
If negative controls have some high values that seem to fit a bimodal distribution  Finite mixture model (2-component model with Gaussian distributions)  Sample mean plus 3 standard deviations on the logarithmic scale 
No controls available Finite mixture model Calculated from full distribution of study results

Refer to Section 5.5 of the PAHO Toolkit

Using Multiple Antigens Together

Using multiple antigens together can provide a more complete exposure history, making these data valuable for disease surveillance programs. The utility of multiple antigens can vary depending on whether those antigens come from the same or different pathogens.  

When testing multiple antigens from the same pathogen, researchers should consider what seropositivity to each antigen indicates.  

Some antigens may be seropositive in response to a single exposure while others may become positive after multiple exposures to a pathogen. Other antigens may have short lived versus long lived responses. For example, 

  • Hepatitis B Surface Antigen (HBsAg) has a short-lived immune response and can be used to detect acute and chronic cases of Hepatitis B virus 
  • Hepatitis B Core Antibody (Anti-HBc) is a long-term marker and can be used to identify any past infection. 

Other antigens may only be seropositive as a result of vaccination versus natural infection. For example,  

  • Most SARS-CoV-2 vaccines generate an immune response to the spike protein, but natural infection elicits a response from both the spike and nucleocapsid proteins 
  • Seropositivity to the nucleocapsid protein could be a marker of exposure to the SARS-CoV-2 pathogen rather than the vaccine. 

Multiple antigens from different pathogens can also be used together to identify cross-pathogen vulnerabilities. Though cross-reactivity can cause spurious associations, true associations between different pathogens can help researchers identify regions or groups that may be at risk from multiple pathogens, for instance different pathogens that are transmitted via similar routes. 

Additional metadata


Other data including demographic data can be beneficial to interpret laboratory results for different pathogens. Structured questionnaires accompanying specimen data collection should be time-efficient and meaningful, aiming to minimize the burden on respondents. A minimum core dataset to support the interpretation and application of serosurveillance results for public health decision-making typically includes the following variables, but may vary by the pathogen of interest: 

  • Age 
  • Sex 
  • Geographic location 
  • Date of specimen collection 
  • Vaccination history (if applicable) 

There are currently some efforts to streamline data cleaning and analytical packages. These include Rshiny applications for quality control processes. 

References

Existing sero-analytical tools: 

https://github.com/UCD-SERG/serocalculator (estimating seroconversion) 

https://github.com/seroanalytics/serosolver (to look at antibody kinetics and infection histories)